Understanding Harms: Data and Trends
The Ontario Electrical Safety Report
At ESA, we analyze data from the Ontario Electrical Safety Report (OESR) to anticipate, identify and target the leading causes of electrical related harms in Ontario.
Learn about recent trends ESA has identified in the sections below:
|
|
|
|
|
|
|
|
Overall Electrical Fatalities
The five-year rolling average rate of electrical fatalities in Ontario remains at one per million population.

How we manage electrical fatalities in Ontario:
- Compliance with regulations
- Electrical Inspections
- Increasing education and safety awareness
- Programs and Initiatives
Occupational and Non-occupational Fatalities
Occupational electrical-related fatalities are a particular hazard to those who routinely work near electrical sources. Education and proper protection are essential in preventing electrical injuries at work.
Occupational electrical fatalities and critical injuries remained steady across 2015–2019 and 2020–2024, with a slight rise among electrical trade workers. Non-occupational fatalities have increased.

In recent years, human error was the leading known cause of death (9%), excluding unknown cases. For workplace fatalities, improper procedures and lack of training were cited as common causes.
Non-occupational electrical fatalities rose between 2015–2019 and 2020–2024.

How we manage these electrical-related fatalities:
- Workers safety –
Don’t work live
campaign - Homeowners Electrical Safety Handbooks
- Building recreational Lichtenberg devices
Electrical Injuries (Emergency Department and WSIB)

Workers in the construction and services sectors contribute to the highest number of WSIB lost time injury claims. Injuries to workers include electrocutions or electrical burns.

Note: this section is a reprint of last year’s information as the data for 2015-2024 is yet to be available from the Canadian Institute of Health Information (CIHI).
From 2014 to 2023, there were 9,672 visits to Ontario hospital emergency departments (ED) due to electrical injury. Patients reported the home as the most common location for electrical injury.


Utility Incidents
Utility-related equipment includes electrical equipment and devices used by Local Distribution Companies (LDCs), privately owned companies, or property owners that distribute electricity to customers’ facilities or buildings.
From 2015-2024 there were 24 electrical-related fatalities associated with utility-related equipment, which accounted for 48% of the total electrical fatalities in Ontario.
Overhead powerline contact remains the leading cause of utility-related electrical incidents every year.
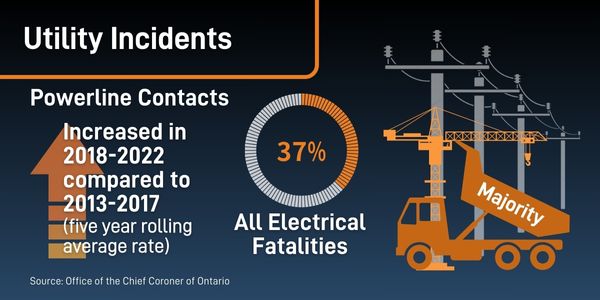
Historically, construction has been the leading sector in overhead powerline contacts; however, in the past five years, incidents reported in public settings have increased. In 2024, there have been fewer than five reported incidents involving LDC workers and overhead powerline contact.
Electrical Fires
Electrical product-related fires involve appliances, cooking equipment, lighting equipment, and other electrical, mechanical, or processing equipment as classified by the Office of the Fire Marshal (OFM) data. The OFM requires a year-long period for data collection and validation, resulting in a reporting lag. Thus, the following information is presented up to the year 2023.
Between 2014-2018 and 2019-2023:
- The five-year rolling average number of fires related to products has decreased by 20%.
- The five-year rolling average for electrical distribution equipment related to aging infrastructure has decreased by 8%.
Cooking equipment (stove, range-top burners) remains the lead ignition source.
How we manage electrical fires:
Product Safety Reports
Ontario Regulation 438/07 Product Safety enables the ESA to address the safety of electrical products and equipment. ESA has oversight for product safety related to the approval of electrical products, including consumer electrical products, before they are sold, used, offered, advertised or displayed in Ontario. ESA also responds to unsafe industrial and commercial products and publicizes product safety notices (including recalls) to protect end users.
Learn how ESA manages harms. Visit "Managing Harms: Programs and Initiatives."
View the 2024 Report & Appendices